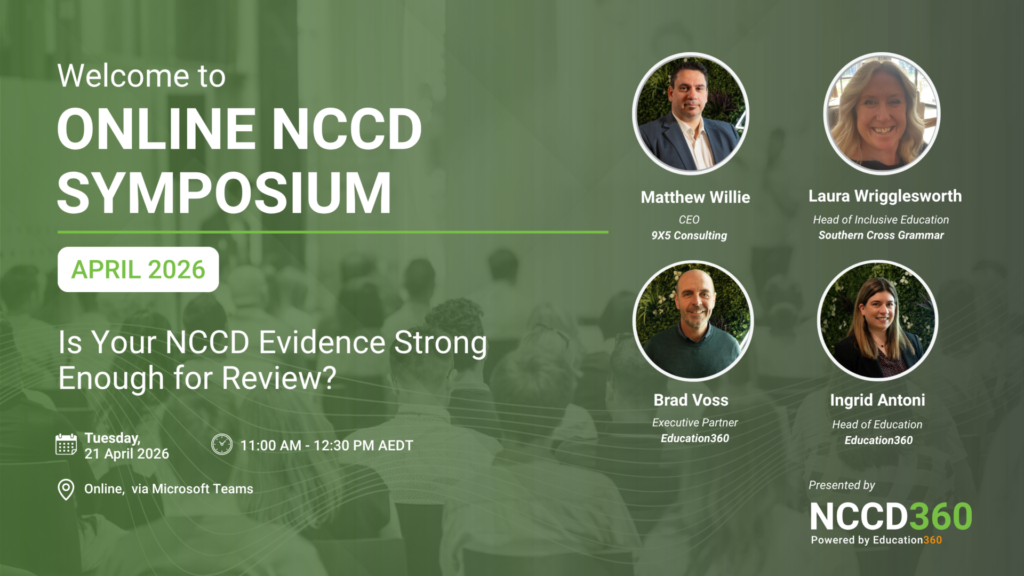
The way schools use data has transformed dramatically over the past few decades. From clunky desktop databases to talking directly to AI for insights, the journey of educational analytics reflects broader technological advances but always with one central goal: improving student outcomes and school operations.
If you’ve worked in education a while, you’ll probably remember each stage and maybe even chuckle at how we once thought “this is as good as it gets.” Let’s take a look at how far we’ve come and where we’re heading.
Early 1990s
The Era of Desktop Databases and Visual Basic Front-Ends
In the early 90s, schools were just beginning to digitise their records. Many school administrators and business managers started experimenting with tools like Microsoft Access. Suddenly, you could build your own databases to track enrolments, attendance, or library loans without waiting for the IT department to build you a custom solution.
Some school staff even created custom Visual Basic forms layered over Access databases. Remember those grey, boxy screens? Principals could enter incident reports, business managers tracked budgets and librarians managed catalogues. But data lived locally, often on one computer and sharing information usually meant printing out reports or passing around floppy disks.
While innovative for its time, these systems were disconnected and manually maintained, leading to inconsistent data quality and a lack of school-wide insights.
Late 1990s to Early 2000s
Emergence of OLAP and Data Warehousing
By the late 90s, schools and education departments were collecting far more data: student demographics, test results, finance data, timetabling and more. Managing all this in local desktop systems became unsustainable.
Enter data warehouses and OLAP (Online Analytical Processing). School IT departments began building central data warehouses where schools’ data could be stored in a structured, consistent format.
Mid to Late 2000s
Rise of Enterprise Reporting Platforms
In the 2000s, enterprise reporting platforms like SAP BusinessObjects, IBM Cognos and Oracle BI became staples in education departments. These tools standardised reporting, ensuring consistent, official versions of key metrics.
Schools received structured reports on attendance, performance trends, finance and compliance data. Dashboards with colour-coded performance charts started appearing in principal briefings and school council meetings.
But let’s be honest: these reports were often static PDFs. Want a new filter or a different graph? Back to IT with a change request. Staff wanted to ask their own questions of the data, but these tools weren’t built for exploration, they were built for consistency and governance.
Early 2010s
Democratisation of Data with Self-Service BI Tools
The early 2010s ushered in a seismic shift. Tools like Tableau, QlikView and later Power BI introduced the era of self-service analytics. For the first time, school leaders, teachers, and business managers could connect directly to data sources and create their own dashboards and visualisations. Principals could analyse attendance patterns by term, identify subjects with declining grades, or explore how different interventions impacted student outcomes, all without waiting for the central office. However, this was only possible If you had an IQ of over 155 and understand the difference between structured, semi-structured and unstructured data.
A New Level of Insight and Chaos
Remember how exciting it was to drag and drop fields into colourful charts? Suddenly, school staff became “data explorers.” The learning curve was steep for some, but many embraced the freedom. However, this freedom came with challenges. Different staff built slightly different reports using different filters or definitions. One school’s “student retention rate” might not match another’s. IT departments scrambled to introduce governance frameworks to keep the data consistent and accurate. Still, self-service analytics fundamentally changed the game, making data a daily tool for decision-making, not just a compliance obligation.
Late 2010s
Cloud-Based Analytics and Real-Time Data Integration
By the late 2010s, cloud computing swept through the education sector. Platforms like Azure, AWS, and Google Cloud made storing and analysing data cheaper, faster and more scalable. Instead of waiting for overnight reports, schools could access near real-time dashboards. School leaders started monitoring live attendance feeds, tracking student engagement in learning platforms, and receiving instant alerts on critical incidents.
Anytime, Anywhere Access
Dashboards became accessible on tablets and phones. A principal visiting a classroom could pull up live data on student performance right in the corridor. Business managers could check budget reports from home. Remember how we used to wait for end-of-term reports to analyse student outcomes? Now, schools could spot trends mid-term and adjust interventions immediately.
Early 2020s
Integration of AI and Predictive Analytics
As we entered the 2020s, analytics moved beyond simply describing what happened. Schools began using predictive and prescriptive analytics to forecast what might happen next and decide what to do about it.
Predictive Insights in Schools
Machine learning tools, often integrated into platforms like Power BI or Azure Machine Learning, allowed schools to forecast enrolment numbers, predict which students might be at risk of disengagement, or identify patterns of absenteeism before they became chronic. For example, a school could analyse behavioural data alongside academic results to proactively support students showing early warning signs of falling behind. These tools shifted analytics from reactive reporting to proactive action, a powerful change for educators focused on supporting every student.
Mid-2020s
The Age of Generative AI and Natural Language Interfaces
nd now, here we are in the mid-2020s. Generative AI has arrived in schools, bringing a new wave of innovation.
Platforms like Education360 are embedding technologies like GPT directly into analytics systems. Instead of wrestling with complex dashboards or learning SQL, school staff can simply ask questions in natural language:
- “Which students have had declining results in maths over the past two terms?”
- “How does our school’s attendance compare to the state average this year?”
- “Show me students who might be at risk based on engagement and performance data.”
Generative AI instantly provides charts, narratives, and even predictive insights; all in clear, accessible language.
From Data Reporting to Data Conversations
This marks a profound shift. Analytics in schools is no longer just about compliance reports or performance monitoring. It’s becoming a conversation, a dialogue between educators and their data. Teachers and principals are empowered to explore why trends are occurring and what actions they should take next. It’s a far cry from the days of Access databases and floppy disks.
Looking Ahead
As we look to the future, one thing is certain: data will continue to be central to every school’s mission of improving student outcomes, supporting staff and running efficient operations. Today, schools are expected to respond swiftly to changing needs; from learning gaps and wellbeing concerns to financial sustainability and compliance demands. The right analytics tools can empower staff at every level to make informed, confident decisions.
So here’s the question for every school leader and business manager.
Are you equipping your staff with modern, user-friendly tools to empower data-driven decision-making or are your current processes and technology still stuck in an outdated world of static reports, spreadsheets and manual workarounds?
Generative AI and advanced analytics are no longer futuristic concepts, they’re practical tools which can transform how your school operates and how your staff can support students. Schools which embrace these innovations are discovering new ways to personalise learning, optimise resources and build stronger school communities. If you’re ready to bring modern analytics into your school, contact the data specialists at Education360. Let us help you turn your school’s data into insights to drive real outcomes for your students, staff and community.
Contact us
We’re here to help you
Your data has a story. Let's help you hear it.
Education360 makes school analytics conversational, predictive and actionable. No code, no wait times – just insights that drive outcomes.
Email: info@education360.com.au
Phone number: 1800 950 667


